
Damian, Salazar-Huaraca, Rodríguez-Llerena, Ríos-Rivera, Cargua-Catagna
MORPHOMETRIC
ANALYSIS OF
MICRO-WATERSHEDS IN
ACHUPALLAS PARISH, SANGAY NATIONAL PARK,
ECUADOR
USING GIS
TECHNIQUES
Diego-Armando Damian
1
-Carrión, Silvia-Alexandra Salazar-Huaraca
1
,
Marco-Vinicio Rodríguez-Llerena
1
, Anita-Cecilia Ríos-Rivera
1
and Franklin-Enrique Cargua-Catagna
1
Engineering Faculty
1
, National University of Chimborazo, Ecuador
*email: dieardamian@outlook.com
R
esumen
A
bstract
Introduction
The structure model of the earth is strongly influenced
by watershed as the preferred directions of surface
flows define the erosion mechanisms and sedimentation
(4). These processes are the result of the interaction of
land use, climate, geology, soil type, topography and
vegetation cover (4).
In Geology, relief
and climate are the
primary determinants of running water
ecosystems functioning at the watershed
scale (1, 2). Different workers define
watershed differently. Watershed is a
natural hydrological entity which allows
surface run-off to a defined channel,
drain, stream or river at a particular
point (3). Also it represents run-off and
infiltration areas where rainfall tends to
be drained into rivers, lakes or into sea.
Morphometric analysis provides quantitative description
of the watershed geometry to understand initial slope or
irregularities in the rock hardness, structural controls,
recent diastrophism, geological and geomorphic history
of drainage watershed (5). The evaluated parameters are
classified as geometric, relief and drainage (6), the same
31
The research objective was to determine the morphometric parameters of four micro watersheds of
Zula, Ozogoche, Jubal and Pulpito rivers in the Achupallas parish, Sangay National Park, Ecuador.
Quantitative methods were used in a Geographic Information Systems allowing to obtain different
morphometric parameters the same as establish the vulnerability to events such as floods, erosion
among others. The results show high values of density drain, time of water mass concentration very
low, accidental forms of the micro watersheds and hypsometric curves that determined a tendency
to unstable erosion cycles. In general morphometric characteristics attenuate the effects of flooding.
Only the circular shape of the micro watersheds of Ozogoche and Zula rivers increase the risk of
flooding.
Keywords: morphometric analysis, hypsometric curve, micro-watersheds high andean, floods, GIS
El objetivo del trabajo fue determinar los parámetros morfométricos de cuatro microcuencas de los
ríos: Zula, Ozogoche, Jubal y Pulpito, en la parroquia Achupallas, Parque Nacional Sangay, Ecuador.
Se utilizaron métodos cuantitativos en un Sistemas de Información Geográfica permitiendo obtener
distintos parámetros morfométricos los mismos que establecen la vulnerabilidad a fenómenos como
las inundaciones, erosión entre otros. Los resultados demuestran altos valores de la densidad de
drenaje, tiempos de concentración de masas de agua muy reducidos, formas accidentadas de las
microcuencas y curvas hipsométricas que determinaron una tendencia a ciclos erosivos inestables.
En general las características morfométricas atenúan los efectos de las inundaciones. Únicamente la
forma circular de las microcuencas de los ríos Zula y Ozogoche aumenta el riesgo de inundación.
Palabras claves: análisis morfométrico, curva hipsométrica, microcuencas alto andinas, inundaciones,
SIG
the pedogenesis, such as age, chemical
composition of the materials and
conditions weather (11).
that have wide application as indicators of vulnerability
of the watershed events such as floods, erosion among
others (7). Also, the characterization of a watershed is an
important step towards sustainable management policies,
as it currently does not have studies on the behavior of
water flow and morphometric (8).
Geographical Information System (GIS) techniques are
widely useful in morphometric analysis of watersheds,
as they provide a powerful tool for the manipulation
and analysis of spatial information particularly for the
feature identification and the extraction of information
for better understanding (9). In the present study, a
morphometric analysis was carried out in the Achupallas
micro-watersheds, Sangay National Park using GIS
techniques. The objective was to analyze the influence of
morphometric properties in the behavior of both the flow
and flood, as these parameters can attenuate or intensify
floods (10).
Methodology
Digital elevation model (DEM) with a
resolution of 30 m was used to define
the micro-watersheds and delineate
the drainage network. The work scale
was 1:50,000. The micro-watersheds
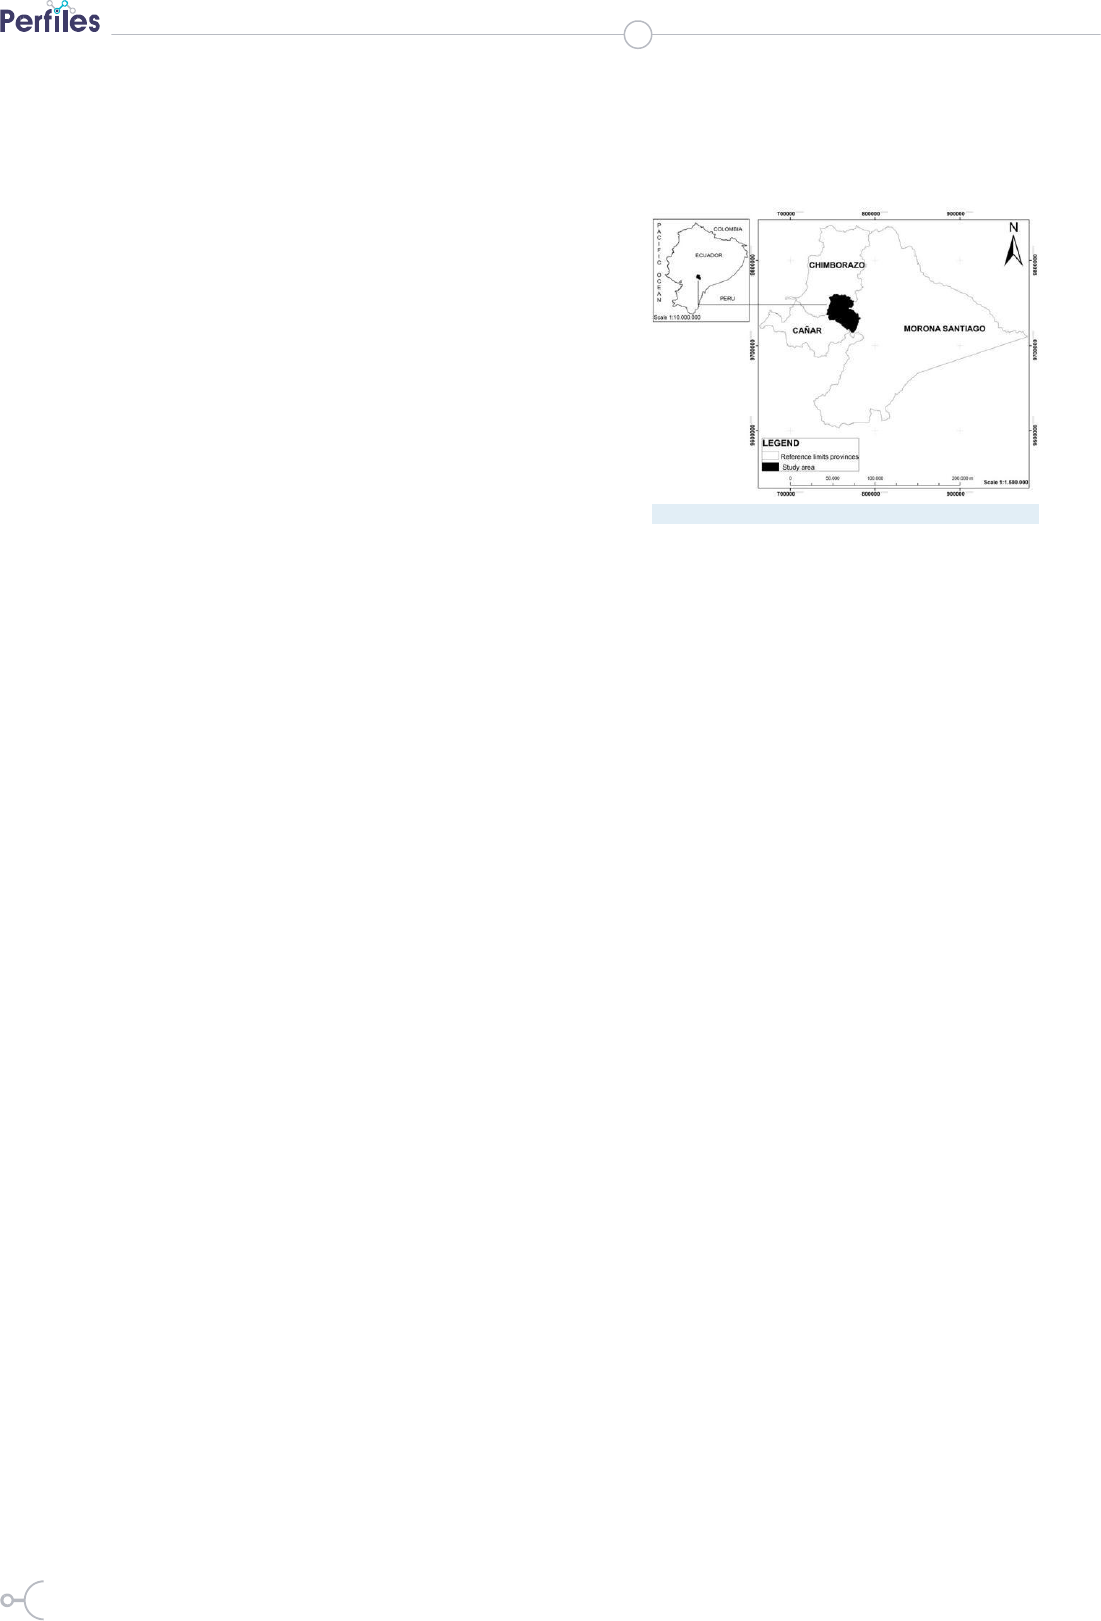
Study area
Achupallas is located in the southwestern part of the
Sangay National Park, Chimborazo province, Ecuador
(Figure 1). The study area covers an area of 1016 km
2
and
it lies on Nudo de Tarqui that joins the western and eastern
mountain ranges, the maximum elevation ranges from
4440 m in the Soroche Mountain to 2000 m in the Guangra
zone. A statistical summary of meteorological data related
to Achupallas for the period 2012-2014 indicates that the
average annual temperature in the northern part of study
area is 9.5°C with daily temperatures ranging between 3
- 18°C, the relative humidity is 74% and average annual
rainfall is 1050.59 mm, finding diverse ecological levels
from paramo to mountain cloud forests. In the southern
part of the study area the average annual temperature
is 8.3°C with daily temperatures ranging between 0 -
17°C, the relative humidity is 83.6% and average annual
rainfall is 1762.51 mm, presenting several montane and
high Andean ecosystems continuous, interrupted only by
some grasses and few crops.
boundaries
were
demarcated
using
the Hydrology tool of ArcGIS Ver.
10.1 software, on the basis of contour
value,
slope,
relief, and
drainage
flow directions. The morphometric
parameters considered for the analysis
are summarized in detail in Tables 1 to 3.
The input parameters for morphological
study such as area, perimeter, elevation,
stream length and others, were obtained
directly in ArcGIS software. Others
morphological
parameters
were
calculated using standard methods with
input values (12-15). The drainage
network of the micro-watersheds was
analyzed per Horton´s laws (16) and
the stream ordering was made after
with Strahler method (5). The drainage
network
of each
micro-watershed
was derived from DEM and it was
delineated with the Stream Order tool.
The hypsometric curve of the micro-
watersheds was made and analyzed per
Strahler method (17) and with Reclassify
tool were determined the areas between
the curves.
This area is the most isolated floristically in relation to
anthropogenic activities. The climate data were taken for
the northern part of the M5140 weather station and for
the southern part were taken of the EMA_Jubal weather
station. Paramo ecosystems have been developed
essentially on pyroclastic deposits resulting from
numerous volcanic eruptions, generating andosol soils
with morphology and properties that vary according to
32
Figure 1. Study area
ISSN 1390-5740 Número 15 Vol. 1 (2016)
ISSN 2477-9105

Damian, Salazar-Huaraca, Rodríguez-Llerena, Ríos-Rivera, Cargua-Catagna
Results and Discussion
The total drainage area of Achupallas was divided
into four micro-watersheds for the analysis: Zula (A),
Ozogoche (B), Jubal (C) and Pulpito (D) (Figure 2.). The
drainage networks of the four micro-watersheds feed
three of the most important watersheds in the country.
The micro-watershed of Zula River forms part of the
upper area of Guayas River watershed and subsequently
flows into the Pacific Ocean.
The micro-watershed of Ozogoche River, form part of
the upper area of Pastaza River watershed and the micro-
watersheds of Jubal and Pulpito Rivers are part of the
upper area of Santiago River watershed. The last three
micro-watersheds flow into Amazonas River. Jubal,
Ozogoche and Pulpito micro-watersheds are within the
limits of Sangay National Park, in a transition zone,
where the warm and moisture currents of the Amazon
converge with cold and dry currents of the Andean
mountains, reason why this zone have a high level of
rainfall, while Zula micro-watershed is far from this site
convergence. It is characterized by the presence of cold
and dry currents with low rainfall (18). The results of
morphometric study are summarized in
Parameter
Formula
Reference
-
Mean height (Ĥ)
H-h
Basin relief (Br)
-
(Pike and
Wilson, 1971)
Hypsometric
integral (Hi)
H: maximum height; h: minimum height.
Formula
Geometric
calculation in
ArcGIS 10.1
Parameter
Length of
main river (L )
r
Reference
-
Drainage
density (Dd)
(Horton, 1945)
Area density (Ad)
(Horton, 1945)
Sinuosity (S)
(Schumm, 1963)
Lr´: Longest dimension parallel to the principal drainage
line; L
t
: total length of the stream segment of all orders; N:
total number of stream segments of all orders.
33
Table 3. Drainage network parameters.
Figure 2. Ozogoche, Zula, Jubal and Pulpito Micro-watersheds inside the
Sangay National Park
Table 2. Relief parameters.
Parameter
Formula
Reference
Area (A)
Geometric
calculation
ArcGIS 10.1
-
Perimeter (P)
Geometric
calculation
ArcGIS 10.1
-
Watershed length (L)
Geometric
calculation
ArcGIS 10.1
-
Watershed width (W)
-
Form factor (Ff)
(Horton,
1932)
Compactness
coefficient (Cc)
(Gravelius
, 1914)
Circularity index (Ci)
(Miller,
1953)
Elongation ratio (Er)
(Schumm,
1956)
Table 1. Geometric parameters.

1
Area
more compact (10). Cc increases when
decreasing compactness. In our case
the compactness coefficient of the four
micro-watersheds is greater than 1.37
indicating that the micro-watersheds are
a somewhat oval, and compactness is
not high. Considering that in a circular
watershed the flood wave takes more
time to reach the mouth and the peak
flow is more pronounced (10), Cc in our
case does not intensify the flood effects,
at least in the mouth.
The watershed area is perfectly defined by its contour
and it is drained area from the division line of water or
divisorium aquarium to the agreed point or mouth. The
areas of each micro-watershed are shown in Table 4.
Ozogoche is the smaller micro-watershed (A<150 km
2
)
and Jubal is bigger (A>400 km
2
) than the others.
2
Perimeter
Watershed perimeter is the outer boundary of the
watershed that enclosed its area (19). The perimeter of
the four micro-watersheds is shown in Table 4. Jubal
has the higher value (P>115 km) and coincides with the
higher value of area, while the perimeter of Ozogoche is
less (P<60 km) than the other micro-watersheds.
6
Elongation Ratio
Elongation
ratio
was
defined by
Schumm (20) as the ratio between the
diameter of a circle of the same area
as the watershed and watershed length.
The value of elongation ratio generally
varies from 0.6 to 1.0 associated with a
wide variety of climate and geology (3).
These values can be grouped into three
categories, namely circular (>0.9), oval
(09-0.8) and elongated (<0.7) (19). Er
values indicate that Ozogoche and Zula
have circular shape while Jubal and
Pulpito have elongate shape. The high
elongated of micro-watersheds does not
intensify the river floods (10).
3
Basin length
The basin length corresponds to the maximum length of
the watershed measured parallel to the main drainage line
(20). The basin length values are shown in Table 4. Jubal
and Pulpito are the longer micro-watersheds (L>20 km)
while Ozogoche has the minimum value of length (L=15
km).
4
Form factor
Form factor was proposed by Horton (16) to predict the
flow intensity of a watershed of a defined area. The Ff of
a drainage watershed is expressed as the ratio between the
area of the watershed and the squared of the basin length.
The value of form factor must be always less than 0.754
for a perfectly circular watershed (19). In our case Jubal
and Pulpito micro-watersheds have values of 0.39 and
0.35 respectively these are lower than 0.754 indicating
them to be elongated in shape and suggesting flatter peak
flow for longer duration. The Ozogoche and Zula micro-
watersheds are similar to the circular shape. Flood flows
in elongated watersheds are easier to manage than in the
circular watersheds (10).
7
Circularity index
The circularity index (5, 13) is expressed
as the ratio of the watershed area and the
area of a circle with the same perimeter
as that of the watershed. Circularity
index range from 0.4 to 0.5 indicates
watersheds strongly elongated with
homogenous geologic materials highly
permeable (13). In this case, circularity
index values vary between 0.38 to 0.53,
indicating that the area is characterized
by high relief and the drainage system is
structurally controlled.
5
Compactness Coefficient
According to Gravelius (21), compactness coefficient
of a watershed is the ratio of perimeter of watershed to
circumference of circular area, which equals the area
of the watershed. When the index is closets to the unit,
the watersheds has a circular shape and therefore is
8
Mean height
The mean height is referred to sea
level. This value can be found using the
34
ISSN 1390-5740 Número 15 Vol. 1 (2016)
ISSN 2477-9105

Damian, Salazar-Huaraca, Rodríguez-Llerena, Ríos-Rivera, Cargua-Catagna
Parameters
Ozogoche
149.97
59.43
15
10.00
20.60
0.67
1.37
0.53
0.92
4.585
3.521
4.119
1.064
30.64
56
V
92.94
20.59
0.62
1.66
2.18
Zula
268.16
93.67
17.60
15.24
25
0.87
1.61
0.38
1.05
4.431
2.482
3.764
1.949
15.68
66
V
233.18
24.96
0.87
1.93
1.89
Jubal
429.66
119.48
33.25
12.92
46.8
0.39
1.63
0.38
0.70
4.635
1.930
3.760
2.705
6.30
68
IV
161.27
46.81
0.91
2.66
1.32
Pulpito
168.46
71.12
22
7.66
29.7
0.35
1.55
0.42
0.67
4.637
1.930
3.575
2.707
23.19
61
V
392.91
29.74
0.96
2.67
1.40
Area (km
2
)
Perimeter (km) Watershed
length (km) Watershed
width (km) Length of
main river (km) Form
factor
Compactness coefficient
Circularity index
Elongation Ratio
Maximum height (km)
Minimum height (km)
Mean height (km)
Watershed Relief (km)
Coefficient of massiveness
Hypsometric integral (%)
Stream order
Stream lenght (km)
Length of main river (km)
Drainage density (km
-1
)
Stream frecuency (km
-2
)
Sinuosity
hypsometric curve calculating the
area
Hypsometric analysis, or the relation of horizontal cross-
sectional drainage watershed area to elevation, was
developed in its modern dimensionless form by Langbein
(24). This curve determines how the mass is distributed
within a watershed from base to top (13, 20, 25). The
shape of the hypsometric curve varies in early geologic
stages of development of the drainage watershed, but
once having attained an equilibrium, or mature stage,
tends to vary little thereafter (15). Generally the curve
properties tend to be stable in homogeneous rock masses
and to adhere generally to the same curve family for a
given geologic and climatic combination (17).
under the curve and dividing by the total
area of the watershed (Table 2). The Ĥ
of the four micro-watersheds is shown
in Table 4. Ozogoche micro-watershed
presents the highest value of mean
height (4119 m).
9
Basin Relief
Basin relief is the difference in the
elevation between the highest point of
a watershed and the lowest point on the
valley floor (22). In this study, Jubal
and Pulpito micro-watersheds present
values above to 2700 m of watershed
relief. These values confirm the variety
of altitudinal levels and the many
ecosystems in the area. Since by each 500
m of basin relief is evident a variation
The hypsometric curves of Jubal, Pulpito and Zula micro-
watersheds have convex shape (Figure 3) indicating that
its territory is composed of a set of geologically young
landscapes characterized by mountainous and rugged
areas. Also these curves indicate that the rivers are in
constant erosion of their channels, with the subsequent
transport of solid material. While Ozogoche watershed
is formed by less high mountains and vast plains also
this micro-watershed is characterized by the presence
of wetlands and marshes, being Ozogoche the most
important lake system. Its rivers are in a transitory state
between the young and equilibrium so the erosion is less.
of
ecological
systems
presenting
important variations in precipitation and
temperature (23).
10
Hypsometric curve
35
Table 4. Results of morphometric analysis.

11
Hypsometric integral
13
Stream Length
The
hypsometric integral is a geomorphological
Stream length is the total length of
streams in a particular order (3). The
number of streams of various orders
in the micro-watersheds were counted
and their lengths measured based on the
Horton´s law. Generally, the total len-
gth of stream segments is maximum in
first order streams and decreases as the
stream order increases (29). Deviation
from its general behavior indicates that
the terrain is characterized by high relief
and/or moderately steep slopes, under-
lain by varying lithology and probable
uplift across the watershed (30). In the
present study only the Zula micro-wa-
tershed confirms Horton
‟
s second law
(1945) showing a linear relationship be-
tween the stream order and the stream
length (Table 5). The others three mi-
cro-watersheds present a small deviation
of a straight line in superior orders.
parameter classified under the geologic stages of
watershed development (26). The hypsometric integral is
also an indication of the cycle of erosion (25, 27). The
erosion cycle can be divided into three stages monadnock
(old) (Hi ≤ 0.3), in which the watershed is fully
stabilized; equilibrium or mature stage (0.3 ≤ Hi ≤ 0.6);
and inequilibrium or young stage (Hi ≥ 0.6), in which the
watershed is highly susceptible to erosion (25, 26, 28).
In this case Zula, Jubal and Pulpito micro-watersheds
present values of Hi above 60% indicating that these
micro-watersheds are in inequilibrium stage and the
erosion process is very high. While Ozogoche micro-
watershed is finishing the young stage and approaches
equilibrium because the Hi is equal to 56%. Hi values
confirm the observed in the hypsometric curves.
12 Stream Order
The designation of stream order is based on hierarchic
ranking of streams proposed by Strahler (5). The
first
order
streams have no tributaries. The second order streams
have only first order streams as tributaries. Similarly,
third order streams have first and second order streams
as tributaries and so on (3). The stream order dates (Table
5) indicate that Ozogoche, Zula and Jubal are designated
as fifth order micro-watersheds having a total of 249, 517
and 1145 stream segments of different orders respectively
(Figure 4). These values of stream order indicate that each
micro-watershed possess a structured drainage network
with perennial rivers that empty quickly the water of the
constant rainfall originated in the transition zone between
the paramo and Andean forest.
14
Drainage Density
Drainage density is the measure of the
total length of the stream segments of all
orders per unit area (31). Dd is influen-
ced by numerous factors, among which
resistance to erosion of rocks, infiltra-
tion capacity of the land and climatic
conditions high rank (32). The drainage
density of the micro-watersheds varies
between 0.62 to 0.96 km/km
2
indica-
ting a very low drainage density. This
suggests that micro-watershed soils are
highly permeable and covered by thick
36
Figure 3. Hypsometric curves.
Figure 4. Hydrometric classification according the
Strahler (1957) method.
ISSN 1390-5740 Número 15 Vol. 1 (2016)
ISSN 2477-9105

Damian, Salazar-Huaraca, Rodríguez-Llerena, Ríos-Rivera, Cargua-Catagna
vegetation (33).
se in streams population with respect to increase in drai-
nage density.
15
Stream Frequency
16
Sinuosity
Stream frequency is the total number of
stream segments of all orders per unit
area (12). For the present study stream
frequency is low varying between 1.66
and 2.67. This indicates a relatively low
run-off. Table 4 shows close correlation
with the drainage density values of four
micro-watersheds indicating the increa-
Sinuosity has been defined as the ratio of channel length
to down valley distance (34). In general, its value varies
from 1 to 4 or more. Rivers with a sinuosity of 1.5 are
called sinuous, and above 1.5 are called meandering (35).
Values of Ozogoche and Zula micro-watersheds are abo-
ve to 1.5 indicating that these rivers are meandering and
other two are sinuous because the values are less 1.5.
Conclusions
lake system. The shape parameters also reveal the
elongation of the Jubal and Pulpito micro-watersheds
and the almost circular shape of the Zula and Ozogoche
micro-watersheds. Due to this characteristic, the two first
micro-watersheds will have flows flood longer lasting
but smaller peak flows compared to Zula and Ozogoche
micro-watersheds that present higher risk of flood by the
most pronounced peak flows.
Fluvial morphometric analysis using
geospatial tools derives quantitative
information on the geometry of the
watersheds in less time and cost, this
information can be correlated with
hydrological
data for appropriate
management of them.
The drainage density indicates a wide vegetation cover
and hard lithology, also high
infiltration
rates that feed the
underground flow favoring the increase of concentration
time and peak flow decrease.
The relief parameters and hypsometric
curves of Zula, Jubal and Pulpito
micro-watersheds defined mountainous
areas with high altitudinal gradient and
rivers in continued erosion by natural
or anthropogenic effects. Also these
In general we can conclude that the morphometric
characteristics not increase rather attenuate the effects
and vigor of floods. Only the circular shape of Zula and
Ozogoche micro-watersheds can increase the flood risk.
micro-watersheds have
landscapes
geologically young that after long time
they will reach equilibrium increasing
the inter-Andean plains.
Acknowledgements
While
hypsometric curve
of
the
We gratefully acknowledge the helpful support and
comments of PhD. Benito Mendoza Trujillo. Also we
gratefully to the SENESCYT by support the university
research.
Ozogoche watershed indicates that its
territory is in a transitory state between
the young
Its relief
mountains
stage and the equilibrium.
is formed by less high
and vast plains, also, this
micro-watershed is characterized by
the presence of wetlands and marshes,
being Ozogoche the most important
37
Table 5. Stream order and stream length.
Micro-watersheds
Stream Order
Stream length (km)
I
II
III
IV
V
Total
I
II
III
IV
V
Total
Ozogoche
135
49
13
48
4
249
42.6
29.4
7.79
12.4
0.78
92.94
Zula
282
107
93
31
4
517
101
73.2
39
16.5
4.05
233.18
Jubal
555
282
200
24
84
1145
190
99.8
68.7
9.08
25.02
392.91
Pulpito
225
126
21
77
-
449
85.3
47.5
5.69
22.8
-
161.27

R
eferencias
38
1. Lotspeich FB, Platts WS. An integrated land-aquatic classification system. North American
Journal of Fisheries Management. 1982;2:138-187.
2. Frissell CA, Liss WJ, Warren CE, Hurley MD. A hierarchical framework for stream habitat
classification: viewing streams in a watershed context. Environmental Management. 1986;10:199-
214.
3. Chopra R, Dhiman RD, Sharma PK. Morphometric analysis of sub-watersheds in Gurdaspur
District, Punjab using remote sensing and GIS techniques. Journal of the Indian Society of Remote
Sensing. 2005;33(4):531-540.
4. Iroume A. Sediment transport in a mountainous catchment in the Andes of the Ninth Region
of Chile. Bosque (Valdivia). 2003;24(1):125-160.
5. Strahler AN. Quantitative geomorphology of drainage basins and channel networks. In: Chow
VT (ed), Handbook of applied hydrology. New York: McGraw Hill Book Company. 1964.
6. Tonello KC, Dias HCT, Souza ALd, Alvares CA, Ribeiro S, Leite FP. Morfometria da bacia
hidrográfica da Cachoeira das Pombas, Guanhães-MG. Revista Árvore. 2006;30(5):849-906.
7. Cardoso C, Teixeira HC, Boechat CP, Venâncio S. Caracterização morfométrica da bacia
hidrográfica do Rio Debossan, Nova Friburgo, RJ. Revista Árvore. 2006;30(2):241-249.
8. Matter MA, Garcia LA, Fontane DG, Bledsoe B. Characterizing hydroclimatic variability in
tributaries of the Upper Colorado River Basin. Journal of Hydrology. 2009;380(3):260-336.
9. Vijith H, Satheesh R. GIS based morphometric analysis of two major upland sub-watersheds
of Meenachil River in Kerala. Journal of the Indian Society of Remote Sensing. 2006;34(2):181-
186.
10. González AI. Análisis morfométrico de la cuenca y de la red de drenaje del río Zadorra y sus
afluentes aplicado a la peligrosidad de crecidas. Boletín de la Asociación de Geógrafos españoles.
2004;38:311-340.
11. Cargua FE, Rodríguez MV, Recalde CG, Vinueza LM. Cuantificación del Contenido de
Carbono en una Plantación de Pino Insigne (Pinus radiata) y en Estrato de Páramo de Ozogoche
Bajo, Parque Nacional Sangay, Ecuador. Información tecnológica. 2014;25(3):83-934.
12. Horton RE. Drainage basin characteristics. Transactions American Geophysical Union.
1932;13:350-411.
13. Miller VC. A quantitative geomorphic study of drainage basin characteristics in the Clinch
Mountain area, Virginia and Tennessee. Journal of geology. 1953;65(1):30-40.
14. Schumm SA. Sinuosity of alluvial rivers on the Great Plains. Geological Society of America
Bulletin. 1963;74(9):1089-1189.
15. Strahler AN. Quantitative analysis of watershed geomorphology. Transactions American
Geophysical Union. 1957;38: 913-933.
16. Horton RE. Erosional development of stream and their drainage basin: hydrophysical approach
to qualitative morfology. Geological Society of America. 1945;56:275 - 370.
17. Strahler AN. Hypsometric (area altitude) Analysis of Erosional Topography. Geological
Society of America Bulletin. 1952;63:1117 - 1159.
18. Morrone JJ. La zona de transición Sudamericana. Acta entomológica chilena. 2004;28(1):41-
50.
19. Pareta K, Pareta U. Quantitative morphometric analysis of a watershed of Yamuna basin,
India using ASTER (DEM) data and GIS. International Journal of Geomantic and Geosciences
2011;2(1):248-317.
20. Schumm SA. Evolution of drainage systems and slopes in badland, at Perth Amboy, New
Jersey. Geological Society of America Bulletin 1956;67(597-646).
21. Gravelius H. Flußkunde. Grundriß der gesamten Gewässerkunde (Bd 1. 1914.
22. Singh RK, Bhatt CM, Prasad VH. Morphological study of a watersheds using remote sensing
ISSN 1390-5740 Número 15 Vol. 1 (2016)
ISSN 2477-9105

Idrovo-Novillo, Gavilanes-Terán
39
and GIS techniques. Hydrology Journal. 2003;26(1, 2 ):55-66.
23. Holdridge LR. Ecología basada en zonas de vida. Costa Rica: Instituto Interamericano de
Cooperación para la Agricultura. 1987. p. 216.
24. Langbein WB. Topographic characteristics of drainage basins. 968C. USA: US Government
Printing Office; 1947.
25. Strahler AN. Hypsometric analysis of erosional topography. The Geological Society of
America Bulletin .1952;63(11):1117-1159.
26. Singh O, Sarangi A, Sharma MC. Hypsometric integral estimation methods and its relevance
on erosion status of North-Western Lesser Himalayan watersheds. Water Resource Management.
2008;22(11):1545-1605.
27. Garg SK. Geology - the science of the earth. New Delhi: Khanna Publishers. 1983.
28. Sarangi A, Bhattacharya AK, Singh A, Singh AK. Use of geographic information system
(GIS) in assessing the erosion status of watersheds. Indian Journal Soil Conserve 2001;29:190-195.
29. Mesa LM. Morphometric analysis of a subtropical Andean basin (Tucumán, Argentina).
Environmental Geology. 2006;50(8):1235-1277.
30. Singh S, Singh M. Morphometric analysis of Kanhar river basin. National Geographical
Journal of India. 1997;43(1):31-43.
31. Javed A, Khanday MY, Ahmed R. Prioritization of sub-watersheds based on morphometric
and land use analysis using Remote Sensing and GIS Techniques. Journal of the Indian Society of
Remote Sensing .2009;37(2):261-335.
32. Verstappen HT. Applied geomorphology: geomorphological surveys for environmental
development. Amsterdam: Elsevier Science Ltd.; 1983.