
50
Número 16 Vol. 2 (2016)
TECHNICAL-ECONOMIC ANALYSIS OF A AC/DC MICROGRID
FOR PUBLIC HEALTH INSTITUTIONS WITH LOW ELECTRICAL
DEMAND. CASE STUDY: PERÚ
In this paper, we analyze the implementation of a microgrid with a photovoltaic solar plant in health
facilities of the Level I and II according to the categorization of the Ministry of Health of Peru. The
study includes both technical (microgrid control and power management) and economic develop-
ments under a project investment horizon of 15 years. The mathematical modeling and numerical
simulations in Matlab/Simulink are used to demonstrate the feasibility of the project investment.
In addition, details of the PV system design and connectivity scheme with external grid are shown.
Also, its main characteristic is to allow only the entry of missing energy from external power supply
and not have storage systems. The mathematical model has taken into consideration 3-scenarios:
pessimistic, average and optimistic. This paper is a contribution to the implementation of microgrids
in the society and contribution to places that have not yet taken advantage of the solar resource for
electricity generation in health facilities.
KeyWords: Microgrid, Health building, Microgrid control, Power management.
Palabras Clave: Microred, Edicación de salud, Control de microred, Gestión de potencia.
En el presente artículo se analiza la implementación de una microred con una planta solar fotovoltai-
ca en establecimientos de salud del tipo I y II de acuerdo a la categorización del Ministerio de Salud
del Perú. El estudio evalúa tanto el aspecto técnico (control y gestión de potencia de microredes)
y económico bajo un horizonte de proyecto de inversión de 15 años. Modelamiento matemático y
simulación numérica en Matlab/Simulink son usadas para demostrar la factibilidad del proyecto. En
adición, detalles del diseño del sistema fotovoltaico y esquema de conectividad con la red externa
son mostrados. La principal característica de la microred es permitir sólo el ingreso de energía fal-
tante y no tener sistema de almacenamiento. En el modelo matemático tres scenarios han sido consi-
derados: pesimístico, promedio y optimístico. Este artículo es una contribución a la implementación
de microredes en la sociedad y en especial en los lugares en que no se ha aprovechado el sol para la
autogeneración de electricidad en establecimientos de salud.
R
esumen
A
bstract
Jorge-Luis Mírez-Tarrillo
Faculty of Sciences
National University of Engineering (UNI), Lima, Perú.
e-mail: jmirez@uni.edu.pe
INTRODUCTION
The Public Health Institutions (PHI) in Peru are classi-
ed according to their level of complexity in three levels:
I, II and III. The Level I and II are of low and medium
complexity and are located at different latitudes and al-
titudes covering the entire national territory in three
regions which are Coast, Highlands and Jungle respec-
tively. Each PHI needs electricity to operate lighting,
biomedical equipment and other loads. For this, the most
common solution is the connection to the external power
supply provided by a utility. However, for this it has to
pay a bill each month.
In Peru, there are places with high va-
lues of wind speed and solar radiation
(1) which can serve for the self-genera-
tion of electricity and/or heat and can be
protable.
In this regard, the Peruvian government
through the Ministry of Health (MOH)
has been implementing the Program
of Support to the Reform of the Heal-
Revista Cientíca
ISSN 1390-5740
ISSN 2477-9105

51
th Sector II (PARSALUD II), which is
the improvement of the 748 strategic
PHI through the development of Public
Investment Projects (PIP) with a time
horizon of 15 years (2). Each PHI has
roof areas potentially useful for the use
of radiant energy incident and to imple-
ment them with microgrids (MG) with
a good impact on the environment and
reduction of operational costs.
To analyze this case, a mathematical
model was constructed to estimate the
feasibility, return time and volumes of
production/consumption of electricity.
MG are small-scale, supply networks
designed to supply electrical and heat
loads for a small community. From a
grid point of view, the main advantage
of a MG is that it is treated as a contro-
lled entity within the power system. It
can be operated as a single aggregated
load. This ascertains its easy controllabi-
lity and compliance with grid rules and
regulations without hampering the relia-
bility and security of the power utility.
From a customers’ point of view, MGs
are benecial for locally meeting their
electrical/heat requirements. They can
supply uninterruptible power, improve
local reliability, reduce feeder losses
and provide local voltage support. From
a environmental point of view, MGs re-
duce environmental pollution and global
warming through utilization of low-car-
bon technology (3).
MG concept relates to a system which
coordinates locally the demand and su-
pply of energy. MG is essentially an
active distribution network because it
provides a platform for the integration
of various energy sources distributed
through a communications system that
allows control actions at distribution
voltage level (3). There are many pos-
sible congurations which may contain
generation of renewable and non-re-
newable electricity, storage and con-
trollable loads with priority categories
according to the user (4). Therefore, we
want to have: an MG with photovoltaic
(PV) plant; control, monitoring and supervision in auto-
nomous real time in PHI’s electric system and comply
with Peruvian legislation (5).
A MG is not an electrical conguration: (a) without a
load, (b) having only electrical charges, without micro-
sources, (c) without monitoring and control despite ha-
ving microsources, since their operation would not be
quantiable or optimized, (d) a conguration that has all
the elements, but insufcient carbon credits (6).
MATERIALS AND METHODS
About the PHI.
The Ofce of Investment Projects (IPO) of the Gene-
ral Ofce of Planning and Budget of the MOH by RD
No. 010-2012 / EF-68 approved the Minimum Contents
Specic 012 (MCS 012), a technical guidethat authori-
zes the use of renewable energy in PHI [2] but it does
not say how nor mentions modern trends as MG. MOH
by means of PARSALUD makes the evaluation of PHI
called “strategic” to improve their operational capacity
(7), This work is a contribution for the evaluation and
installation of MG in PHI of low electricity demand. The
PHI of Category I and II have usually a roof from 2,000
m
2
to 13,000 m
2
.
Solar Map of Peru.
Peru is politically constituted by 24 regions. A solar map
of Peru is available at (1). The largest PHI are located in
the capital of each region, therefore the solar radiation
in the capital of each regionis considered as a reference.
From (7) three values are assumed: Maximum (Rmax):
6.08 kWh/m
2
day; Average (Rave) 5.17 kWh/m
2
day, and
Minimum radiation (Rmin) 4.42 kWh/m
2
day.
Wind energy was not considered because installation
of wind turbines depends largely on the location; wind
speed varies during the year, depending on the season,
changes daily and have changes in short term (seconds
to minutes) both speed and direction (8). Currently there
exists a wind map of Peru (9) with only general informa-
tion; one needs to installation of measuring equipment in
PHI and needs real time records for an adequate technical
and economic evaluation of the wind resource (10).
PV Solar Panel Technology
There is a continuous improvement in materials and cons-
truction processes in solar panels (11). For this study, a
Jorge Luis Mírez Tarrillo

52
Número 16 Vol. 2 (2016)
standard panel has been selected: Model E20-327-COM
(12) from SunPower Company with nominal power of
327 Wp, average panel efciency of 20.4 %, panel area
of 1.63 m2, weighing 18.6 kg and 1046 x 1558 mm of
dimensions. (12). It cost in the Peruvian market is US
$ 1/W including installation. The lifetime of solar panel
selected exceeds the duration of PIP in 10 years.
Proposal connection between external electrical ne-
twork and MG of PHI
The proposed conguration is shown below in Fig.1.
where: “PV” are the PV solar panels; “M” is a electricity
meter that measures the energy coming from the external
power grid; “I” is a microsource controller (3,6); DC/
AC converter of energy from the solar panels, can syn-
chronize the phase, can let ow from the external power
supply the amount of missing energy to complete the
need of electricity of IHP; “PCA” is the Point of Com-
mon Coupling that connects/disconnects the MG of the
utility network (13); “C” is MG central controller (3,6)
that communicates bidirectional with General Electric
Board (GEB). Both “I” and “PCA” management makes
the power of the MG under the rule of admitting only
missing input power from the external power supply, too
“C” has the adequate human-machine interface (HMI)
(3,6); “A” brings together the control, management and
monitoring equipments of MG proposal; it is of accor-
ding at the state of art actual in MG with good reliability,
low unavailability and little interruptions (6).. “A” could
be in the future a single assembled element. The cost of
the electricity that companies sell has also been conside-
red. In this there are two scenarios, buy in low voltage
(LV) and/or medium voltage (MV). PHI Level I usually
feed on 220V (single phase) or 380/220 V (three phase).
The PHI level II, usually purchased in MV with nomi-
nal voltage of 10 kV or 22.9 kV. The price of electricity
in both low voltage “PrBT” and MV “PrMT” are [14]:
PrBT = 0.38115 US$/kWh and PrMT = 0.05705 US$/
kWh. In all cases the cost assumed of “A” is C (C_C)
equal to US $ 3,500.00
Figure 1: Proposal of microgrid in electric network
where: PRG is percentage growth rate,
t2 is time at the end of the study period,
t1 is the initial time of the study phase,
X(t1) is the variable to deduce their be-
havior when baseline and X(t2) is the
variable at the end point of the study
period. Something similar is done with
the prices in LV and MV where the per-
centage of annual growth in electricity
prices (PRG) will be equal to 3.9% (16)
to calculate the evolution of prices du-
ring the PIP.
Mathematical Model
The radiant energy incident on the area
where the solar panels will be arranged
is calculated based on average values
recorded incident of solar radiation, ac-
cording to:
where: maximum energy radiated for a
day is “Emax”, “Eave” is average value,
and “Emin” is minimum daily radiation
energy. It is considered that “A” has
three scenarios:
Given that Peru is located close to the
equator, the amount of daily hours of
sun is approximately 12 hours, the daily
energy available can supply an electric
charge to daily power average electric
“Pp”, for which, a given amount of solar
panels “Upv” is needed, therefore:
where: “fa” is an adjustment factor that
indicates the amount of energy consu-
med during daylight hours and we con-
sidered fa = 0.70; “Emes” is the mon-
thly electric energy consumed by the
General Considerations
The growth rate of the maximum power
demand to future isassumed as the same
value as the percentage growth rate
of the population (15) of the region to
study. The equations for calculating the
growth in electricity demand will be ac-
cording with (5):
XXe
tt
PRG
tt
() ()
()
21
21
=
−
Emax,ave,min [kWh/day] =
AR
maxave min
×
,,
Pp [kW] =
fa Emes×
Pec_MTmax,ave,min(t) = PrMT(t) Days(t) Ppmax,ave,min(t)
Revista Cientíca
ISSN 1390-5740
ISSN 2477-9105
53
The amount of solar panels required is
calculated by the following equation:
The initial cost [US$] of the MG
“C_in” is:
Fifteen years of PIP involves 5475
days. This represents a payment in
purchased energy “Pec” therefore
low voltage “Pec_BT” and MV
“Pec_MT” of:
where “Ppmax”, “Ppave” y“Ppmin” are the
average powers: maximum, average and
minimum deducted from the scenarios:
“Emesmin”, “Emesave” y “Emesmax”.
During PIP’s lifespan, the price of MG
is amortized progressively considering
the following calculation of real value
(VR) (5) for both tariff LV (VR_BT) and
tariff MV (VR_MT):
Similarly, the incident radiant ener-
gy converted into electrical energy for
one day, quantied as “Emax”, “Eave”,
“Emin”; is primarily affected by the ef-
ciency of the solar panel “η”, then the
electrical energy from solar panels for a
day “EEsol” is:
The electricity generated, for this case,
will make the price of energy at low vol-
tage “PrBT” because it resembles the
voltage level and the form of equipment
that is supplied through the distribution
network. The price at the time is calcula-
ted using equation 4. Therefore, during
PIP, sales price of energy produced from
solar panels “CEEsol” is valued accor-
ding:
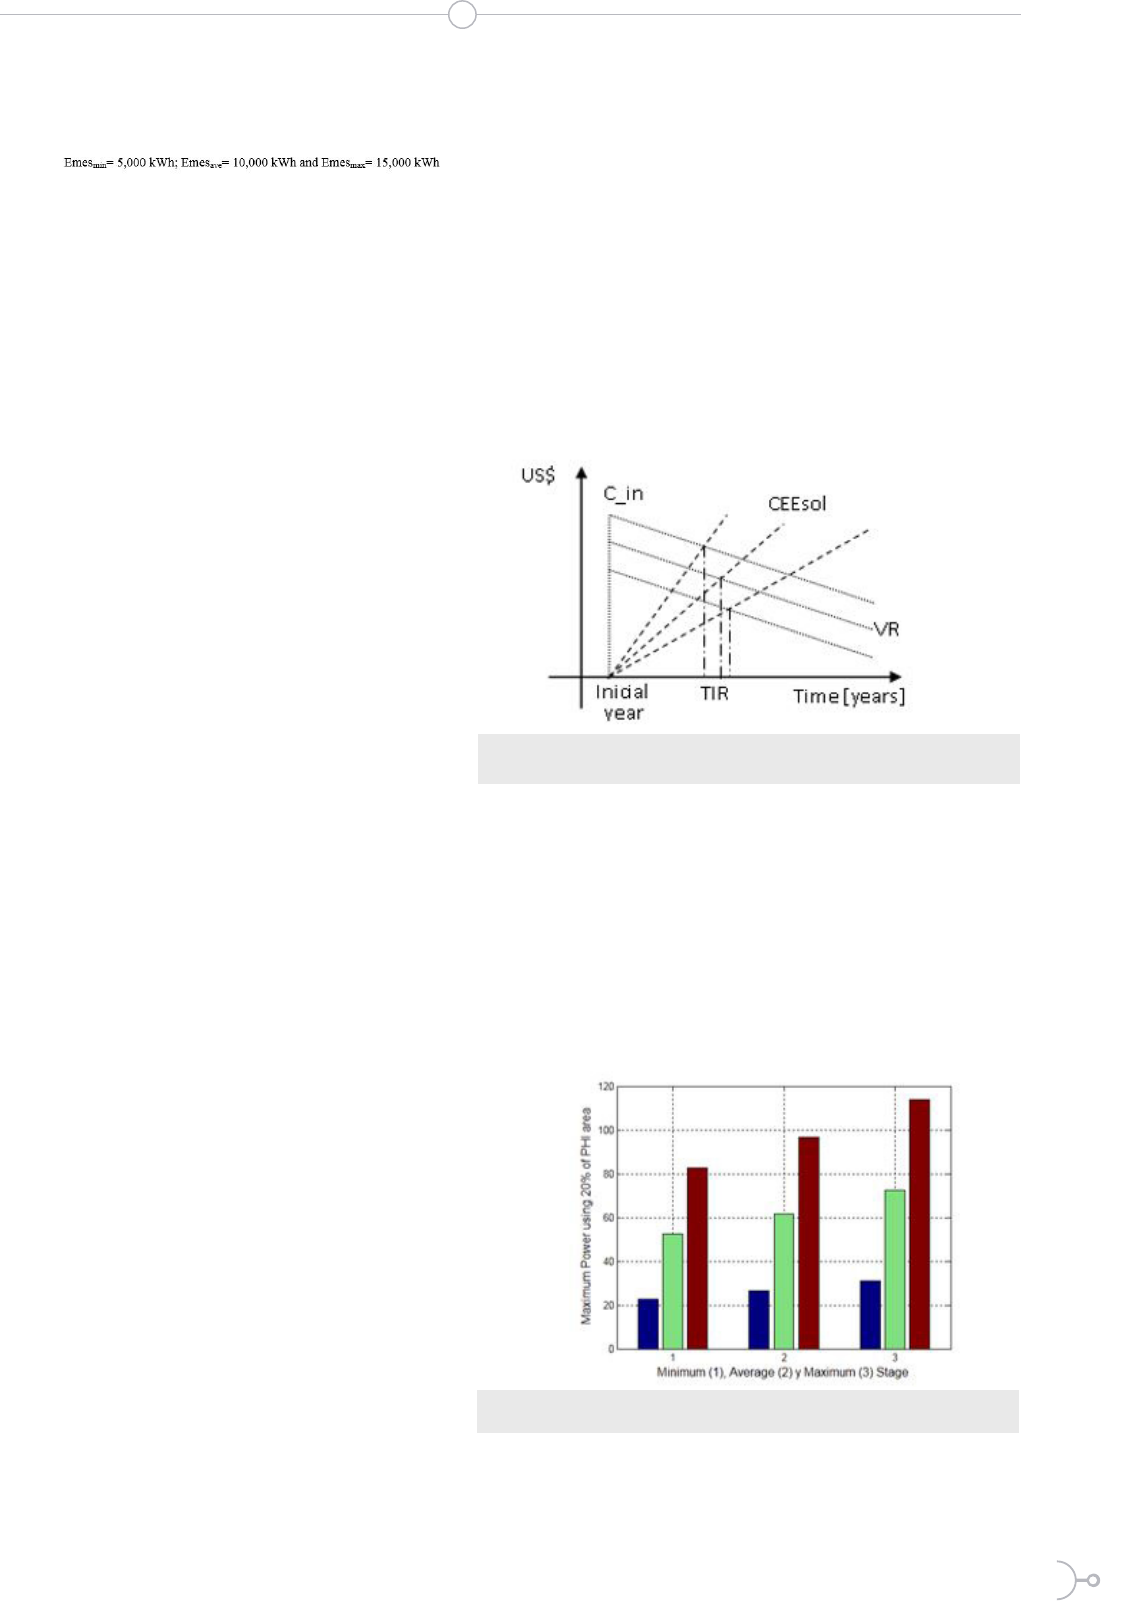
In short, installation of MG in PHI consists of an initial
cost which is amortized by the cost of energy to stop bu-
ying in LV or MV, likewise, the energy produced repre-
sents a value that gradually increases in the time. In any
time, both values of MG and production are equalized
to represent return time of investment, the MG pays for
itself. Fig. 2 shows the trend where “TIR” is the return
time investment, and; “VR” is real value of MG. Three
curves of scenarios is shown: optimistic (sufx “max” in
variables), average (sufx “ave”) and minimum (sufx
“min”).
Figure 2: Evolution of the actual value of the facility and the value of the energy
produced.
RESULTS AND DISCUSSION
The rst scenario simulated is the power estimated using
20 % of the available area of PHI. For this we considered
the efciency of solar panels, a solar radiation assumed
in Eq. 8 divided by 10 hours of sunshine. Fig. 3 shows
the results, which allow us to verify that the PV plant will
occupy a portion of the available area of PHI.
In the case of Rmin and Amin has 36 PV panels which oc-
cupy 60 m2; in the case of Rmax and Amax are needed 108
Figure 3: Estimated production considering the three scenarios of
“A” and “R”.
Jorge Luis Mírez Tarrillo
PHI in kWh and is considered under the
following three scenarios:
Upv = (Pp
×
1000)/(Pnom)
C_inmax,ave,min = Upvmax,ave,min
×
C
×
327 + C_C
Pec_BTmax,ave,min(t) = PrBT(t)
×
Days(t)
×
Ppmax,ave,min(t)
Pec_MTmax,ave,min(t) = PrMT(t) Days(t) Ppmax,ave,min(t)
×
×
VR_BTmax,ave,min(t) = C_inmax,ave,min – Pec_BTmax,ave,min(t)
Pec_MTmax,ave,min(t) = PrMT(t) Days(t) Ppmax,ave,min(t)
EEsolmax,ave,min = Emax,ave,min η
×
CEEsolmax,ave,min(t) = EEsolmax,ave,min Days PrBT(t)
×
×
54
Número 16 Vol. 2 (2016)
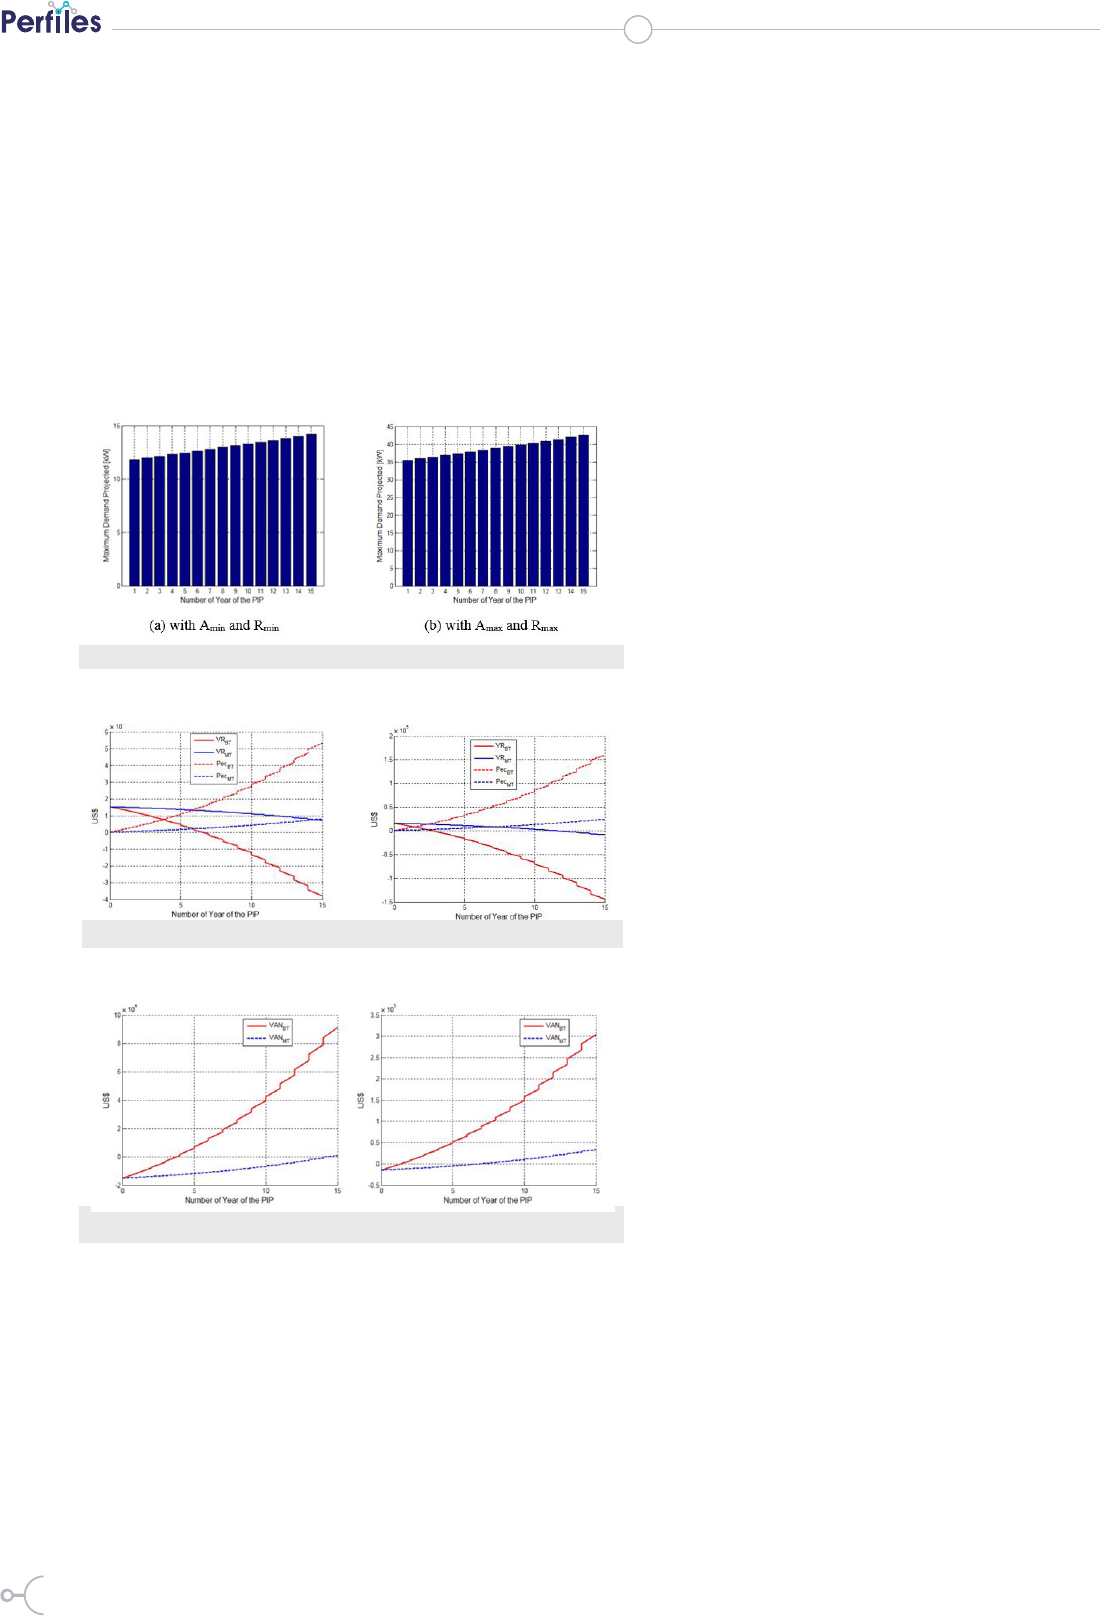
Figure 5: Evolution of the VR and Pec in BT and MT for calculate of TIR
Figure 6: Evolution of VAN into BT and MT for calculate of TIR.
Figure 5 indicates that the return time of the investment
is shorter if there is a higher energy demand. Fig. 6 indi-
cates that it is more benecial for the PHI to buy at LV
instead of buying at MV, but in both cases the return time
is within PIP. It has to be studied at what energy demand
in order to change from LV to MV.
CONCLUSIONS
It has been shown that a PIP horizon of
15 years is viable, reaching a payback (a)
in worst case scenario (Amin, Rmin and
electric demand) within approximately
4 years for users who buy at low voltage
and 14 years for users who buy at me-
dium voltage; and (b) in best scenario
(Amax, Rmax and electric demand) is
about 2.5 years for users who buy atlow
voltage and 6.5 years for users who pur-
chase atmedium voltage.
At the end of PIP (15 years) are still
10 years more of optimal performance
inPV solar panels, which entails that if
is necessary, PHI may increase the capa-
city of PV solar power.
Moreover, there is area available for ins-
tallation of solar thermal equipment for
production of hot water. Both cases lead
to an improvement in PHI economy,
quality of care and working environment
and increase the efciency contributing
to a green image.
The calculation described considers the
PV solar power as a source of electri-
cal power of the base type, that is to
provide important part of consumption
and the remaining (which may be conti-
nuous, intermittent or changing) will be
supplied from the public grid.
Not considered is electrical storage, be-
cause it has a high cost in operation and
maintenance, which will increase the
cost and extend the return time of invest-
ment. The electricity produced by a PV
solar plant in a MG pays itself.
ACKNOWLEDGMENTS
The author thanks to the National Coun-
cil of Science and Technology of Peru,
CONCYTEC for funding his doctoral
research at UNI, also at the Electric
Power System Research Group in San-
dia National Laboratories (USA) during
a internship (Jan – Apr 2016).
Figure 4: Projection of MD during PIP time.
PV panels which occupy 180 m
2
.
A second simulation scenario is to calculate the maxi-
mum demand (MD) during the years of PIP considering
the growth rate of the population, given that as the po-
pulation increases, so does the health care and therefore
the amount of energy that is required for PHI. For this,
two scenarios have been considered: with Amin, Rmin (see
Fig.4a) and Amax, Rmax (see Fig. 4b). In this aspect the
environmental conditions have been assumed constant
over the years.
Revista Cientíca
ISSN 13905740
ISSN 2477-9105

55
R
eferencias
1. Energy and Mines Ministry. Peru Solar Map [Website].http://deltavolt.pe/atlas/atlassolar
2.Ministry of Health of Perú. Strategic Health Establishments: R.M.N° 632-2012/MINSA [Website].
http://www.minsa.gob.pe/Portalweb/EsSa/index.asp
3. Chowdhury S, Chowdhury SP, Crossley P. Microgrids and Active Distribution Networks”.Lon-
don.The Institution of Engineering and Technology. 2009.
4.ArtoNiinistö. Simulation of the Management of a Micro Grid with Wind, Solar and Gas Generators
[Master Thesis]. Aalto University, Finland. 2009.
5. Website Peruvian State. Electrical Legislation: Law of Electrical Concessions and Regulations.
[Website].http://www.peru.gob.pe/docs/PLANES/13049/PLAN_13049_2014_Normatividad_
LCE_y_RLCE.pdf
6. C. Schwaegerl. DG3&DG4 Report on the technical, social, economic, andenvironmental benets
provided by Microgrids on power system operation. Siemens. 2009
7.Ministry of Health of Perú.Program to Support of Health Sector Reform [Website].http://www.
parsalud.gob.pe/
8. Francisco GoncalvesGoianaMesquita. Design Optimization of Stand-Alone Hybrid Energy Sytems
[Master Thesis]. Universidade do Porto, Portugal. 2010.
9.Energy and Mines Ministry.Wind Map of Perú [Website].http://deltavolt.pe/atlas/eolico
10.Masters GM. Renewable and Efcient Electric Power Systems. New Jersey. Jhon Wiley & Sons,
Inc. 2004.
11. Phys.org. NREL demonstrates 45.7% efciency for concentrator solar cell [Website]. United
States of America http://phys.org/news/2014-12-nrel-efciency-solar-cell.html
12.SunPower. Solar Panels for Commercial Use Serie E20-327-COM [Website].http://us.sunpower.
com/sites/sunpower/les/media-library/data-sheets/ds-e20-series-327-residential-solar-panels.pdf
13. Paolo Piagi. Autonomous Control of Microgrids.IEEE PES Meeting 2006.
14. Luz del Sur. Prices for the Sale of Electricity (including tax) Tariff September 2015 [Website].
https://www.luzdelsur.com.pe/media/pdf/tarifas/TARIFAS.pdf. 2015.
15. National Institute of Statistics and Information. Growth Rate of Population for Region [Website].
http://www.inei.gob.pe/media/MenuRecursivo/publicaciones_digitales/Est/Lib0015/cap-52.htm
16. PCR Pacic Credit Rating.Peru Electric Sector: Report at September 2014 [Website].http://www.
ratingspcr.com/uploads/2/5/8/5/25856651/sector_electrico_peruano_201409-n.pdf