
12
ISSN 2477-9105 Número 23 Vol.1 (2020)
AGRUPACIÓN DE GENES EN CIENCIA INTENSIVA: COMPARACIÓN Y
ANÁLISIS DE TENDENCIA MEDIANTE EL ÍNDICE DE ESTABILIDAD
BIOLÓGICA.
Esta investigación evalúa el rendimiento de los algoritmos de agrupación más conocidos utilizando
el índice de estabilidad biológica (BSI). Se realizó una comparación entre los algoritmos de
agrupación, para determinar de estos cuál es el óptimo según el puntaje obtenido en cada algoritmo,
la agrupación de génica en Ciencia Intensiva, el mismo que utiliza bases de datos extensas para
cubrir casi todos los resultados que pudiesen ocurrir realmente. Se aplica este método a una base
de datos de expresión de genes (Microarray). El análisis se lo realizó a la base de datos “mouse”
incluida en el paquete clValid en el software R, para el estudio de las células mesenquimales de
ratones (cresta neural y el mesodermo derivado), también se utiliza métodos gráficos como los
dendogramas para un primer enfoque. Para la selección del algoritmo óptimo, se calculó el índice
biológico de estabilidad para cada algoritmo de agrupación siendo el mejor, el que más cerca
de la unidad se encuentre. En consecuencia, el algoritmo más estable para dicha base de datos
es “Diana”. Para llegar a este resultado se visualizó gráficamente el número de clústeres con la
respuesta obtenida en cada caso; se tomó como el algoritmo óptimo el que más se apegue a la
realidad del problema teniendo en cuenta su puntaje en los índices y además con la ayuda de un
gráfico de filogenética para un ultimo enfoque.
Palabras claves: genes, índices biológicos, estadística, comparación, Ciencia intensiva.
R
esumen
Gene clustering at intensice science: comparison using biological stability index.
Miguel Urgilés Andrade*, Michael Ulcuango Abalco, Rubén Pazmiño Maji
Escuela Superior Politécnica de Chimborazo, Facultad de Ciencias, Grupo de Investigación
Ciencia de Datos/Carrera de Estadística Informática, Riobamba, Ecuador.
*miguel.urgiles@espoch.edu.ec
A
bstract
This research evaluates the performance of the best known clustering algorithms using the
biological stability index (BSI). A comparison was made between the clustering algorithms, to
determine which is the optimum according to the score obtained in each algorithm, the group of
genetics in Intensive Science, which uses extensive databases to cover almost all the results that
could probably really. This method is applied to a gene expression database (Microarray). The
analysis was performed on the "mouse" database included in the clValid package in the R software,
for the study of mouse mesenchymal cells (neural crest and derived mesoderm), graphic methods,
such as dendograms, are used for a first approach. For the selection of the optimal algorithm, the
biological stability index was calculated for each clustering algorithm, the best being the one closest
to the unit. Consequently, the most stable algorithm for this database is "Diana". To reach this
result, the number of clusters with the response obtained in each case was visualized graphically;
the optimal algorithm was taken as the one that most closely matches the reality of the problem,
taking into account its score in the indexes and also with the help of a phylogenetic graph for a
final approach.
Keywords: genes, biological indices, statistics, comparison, intensive Science.
Date of receipt: 20-07-2019 Date of acceptance: 23-12-2019
13
Urgilés, Ulcuango, Pazmiño
I. INTRODUCTION
Cluster analysis is an important exploratory tool
widely used in many areas such as biology, socio-
logy, medicine and business, and the objective of
cluster analysis is to assign objects in a group and
establish in meaningful classes so that objects in
the same class are more similar among themsel-
ves than to those of other classes. (1)
The world of science has changed, and there is
no doubt about this. The new model consist of
data is captured using instruments or generated
through simulations before processing with sof-
tware. The resulting information or knowledge
are collected on computers. Scientists look at the
data rather late in this sequence. Scientists only
get to look at their data quite late in this sequen-
ce. The techniques and technologies for such data
intensive science in data are so different that it is
important distinguishing data intensive science
from computational science as a new paradigm:
the fourth paradigm for scientific exploration (2).
In a clinical application of microarray- based
cancer diagnosis, an important statistical pro-
blem associated with the classification of tumors,
the identification of new classes of tumors using
gene expression profiles (3), hence the importan-
ce of the analysis.
Database: The database consists of: using a com-
bination of genetic marker / selective isolation of
progenitor cells embryonic pluripotent and tech-
nology of micro arrays based on oligonucleotides
to delineate and compare the "molecular finger-
print" of two populations into various lineages of
mesenchymal cells in the developing embryonic
orofacial region. The first branchial arches (bi-
lateral tissue primordia that flank the primitive
oral cavity) are populated by pluripotent me-
senchymal cells of two different lineages: neural
crest (neuroectoderm) and mesenchymal cells
derived from the mesoderm. These cells give rise
to all the elements of the connective tissue (bone,
cartilage, smooth and skeletal muscle, dentin) of
the orofacial region (maxillary and mandibular
portion), as well as the neurons and glia associa-
ted with the cranial ganglia, among others tis-
sues (4).
Microarray or Biochips: The genome of human
beings is a set of genes which are distributed in
chromosomes. Likewise, genes are DNA sequen-
ces that contain all information needed to syn-
thesize proteins, molecules essential for life that
perform virtually cell functions. When a gene is
"activated"to give rise to corresponding protein,
therefore this gene is being expressed in the cell
(5).
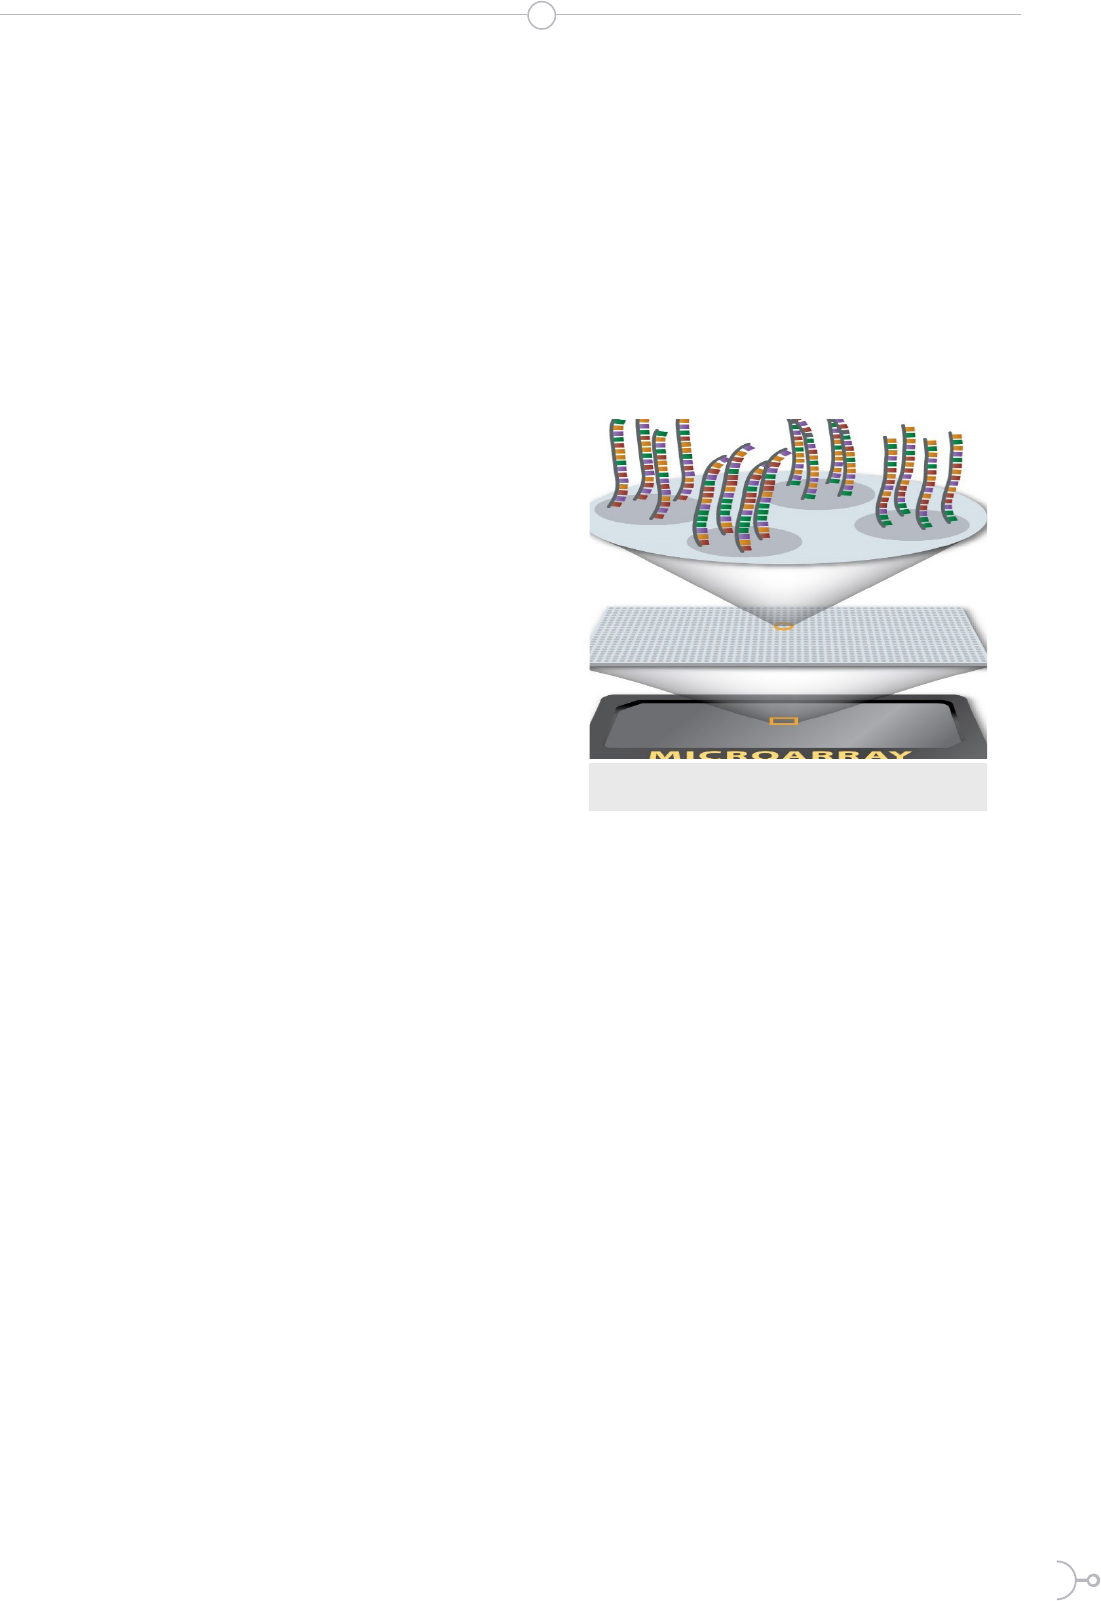
Figure 1. e laser excites the uorescence of the cDNA , gene-
rating signals for the encoding of a microarray (6)
A collection of gene expression data can be seen
abstractly as a table with rows representing ge-
nes, columns that represent several samples and
each position in the table that describe the mea-
surement of a specific gene in a particular sam-
ple . This table is called a gene expression ma-
trix. In addition to the matrix, a description of a
microarray experiment should also contain in-
formation about the genes whose expression has
been measured and the experimental conditions
in which the samples were taken. The informa-
tion required to describe a microarray experi-
ment can be conceptually divided into three logi-
cal parts: genetic annotation, sample annotation
and a gene expression matrix (7).
New techniques in biotechnology, such as mi-
croarrays of cDNA and oligonucleotide chips of
high density, allow simultaneous monitoring of
the expression of thousands of genes in any desi-
red number of conditions (8).
Clustering methods
K-Means: The algorithm K-Means is a typical

14
ISSN 2477-9105 Número 23 Vol.1 (2020)
method of clustering based on division. Given a
certain K value, the algorithm divides the data
into K disjoint groups. The K-means algorithm
is simple and fast. The complexity is O ( l * k * n
), where l is the number of iterations and k the
number of clusters. Furthermore, this algorithm
converges normally in a reduced number of ite-
rations (9).
K-means is a very popular method for general
grouping. In K-means the clusters are represen-
ted by mass centers of the members, and it can be
shown that the K-means algorithm by switching
between assigning membership to the cluster for
each data vector to the nearest cluster center and
calculate the center of each cluster as the cen-
troid of its member data vectors is equivalent to
finding the minimum of a sum of squares cost
function using the coordinate offspring function
(10).
The K- means algorithm is sensitive to outliers
since an object with an extremely large value can
substantially distort the data distribution. How
could the algorithm be modified to decrease that
sensitivity? Instead of taking the average value of
the objects in a cluster as a reference point, a Me-
doid can be used, which is the most centrally lo-
cated object in a cluster. Therefore, the partition
method can be performed based on the princi-
ple of minimizing the sum of the differences be-
tween each object and the reference point corres-
ponding. This forms the basis of the K- Medoids
method (11).
Hierarchical clustering with correlation (Hie-
rarchical): This algorithm produces a hierarchy
of clusters rather than a fixed set number of clus-
ters in advance. At the basic or initial level, each
observation forms its own group. At each sub-
sequent level, the two "closest" groups combine
to form a larger group. The "average" method is
used, which means that “distance" between the
groups is the average (12).
Diana: At each step, a divisive method divides
a group into two smaller ones, until; finally, all
groups contain a single element. This means that
the hierarchy is built again in n-1 steps when the
data set contains n objects. A divisive analysis
proceeds by a series of successive divisions. In
step 0 (before starting the algorithm), all the ob-
jects are together in a single cluster. In each step,
a group is divided, until in step n-1 all objects are
separated (forming n groups, each with a single
object) (13).
Agglomerative nesting: Agnes function: The
Agnes function is of the hierarchical agglome-
rative type; therefore, it produces a sequence of
clusters. In the first grouping, each of the n ob-
jects forms its own separate group. In later steps,
the groups are merged, until (after n - 1 steps)
there is only one large group 18. There are many
of these methods. In Agnes, the group average
method is taken as the default, based on robust-
ness, monotonicity and consistency arguments
(14)
Clustering Large Applications (Clara): It can
deal with much larger data sets. Internally, this
is achieved by considering subsets of fixed size
(size) data so that time and storage requirements
become linear is at n instead of quadratic (15).
Partition around the medoids (Pam): The pam
algorithm is based on the search for k representa-
tive or medoid objects among the observations in
the data set. These observations should represent
the structure of the data. After finding a set of k
medoids, k clusters are constructed by assigning
each observation to the nearest medoid (15).
Biological Validation Measures: Biological vali-
dation evaluates the ability of a clustering algori-
thm to produce biologically significant clusters.
A typical application of biological validation is
in microarray data, where the observations co-
rrespond to genes (where "genes" could be open
reading frames (ORF), expressed sequence
tags (EST), analysis tags of expression of genes
(SAGE), etc.). There are two measures available,
the biological homogeneity index (BHI) and the
biological stability index (BSI) (16) .
These measurements can also be used for any
other molecular expression data. The biological
homogeneity index (BHI) and the biological sta-
bility index (BSI) both assess the performance
of an algorithm to produce biologically similar
15
Urgilés, Ulcuango, Pazmiño
groups. Internal validation measures provide
guidelines on the statistical properties of clusters
(17).
Biological Homogeneity Index (IHB): This
simple measure is easy to interpret and put into
practice once the reference collection of functio-
nal classes is in place. This also works with the
superposition of functional classes. This measu-
re can be thought of as an average proportion of
gene pairs with matching functional classes that
are statistically grouped together based on ex-
pression profiles.
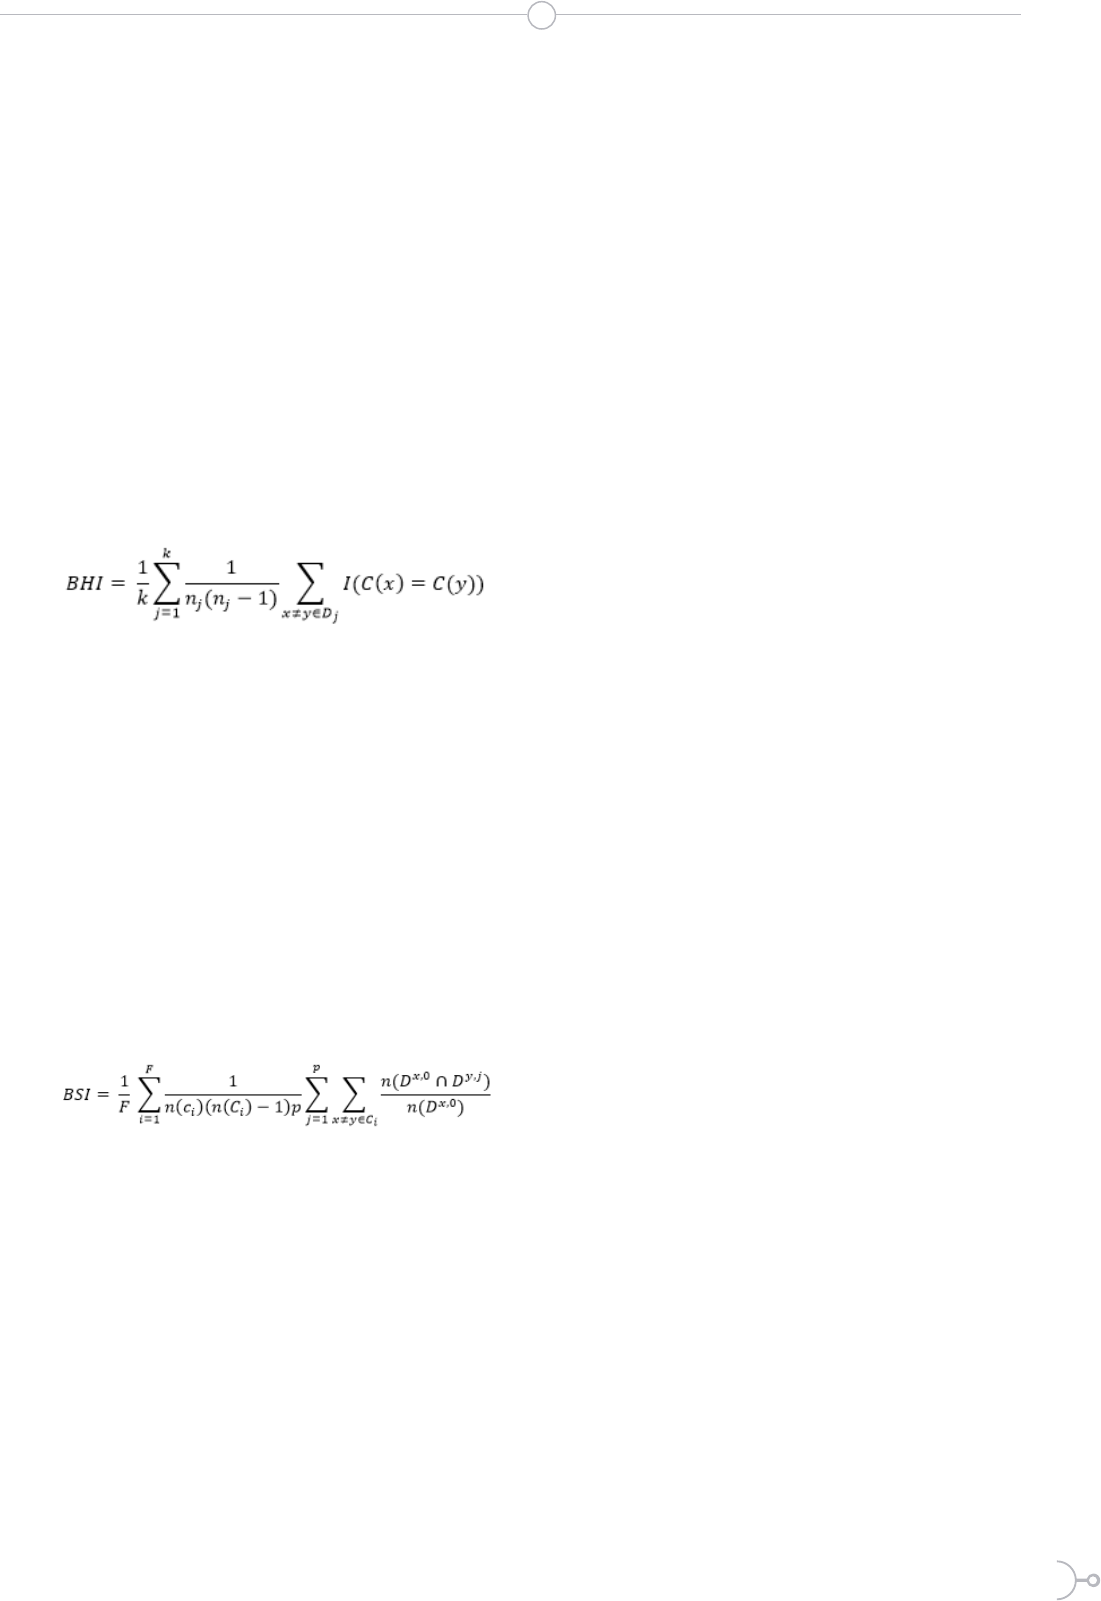
Formula for calculating the index of biological
homogeneity
(1)
Where k is the number of statistical clusters and
for the cluster D
j
, n
j
= n(D
j
ÇC) is the number of
annotated genes in D
j
, and where for a set A,
n(A) denotes size or cardinality (18) .
Biological Stability Index (BSI): Next, the stabi-
lity of a clustering algorithm is captured by ins-
pecting the consistency of the biological results
produced. When an observation unit reduces the
expression profile:
Formula for calculating the biological stability
index
(2)
The calculation of this index consists of 4 steps,
but it is very flashy to perform manually, and this
one is usually done in software, if someone want
to know how to perform the calculation, review
(18) “Biological stability index”.
II. MATERIALS AND METHODS:
It is a quantitative, descriptive exploratory and
non-experimental cross-sectional investigation.
The “R and R-Studio” software was used, as well
as the “Package clValid” version 0.6-6 wich was
published on March, 2008.
The package RV clValid contains functions,
which allow the results validation of a cluster
analysis. There are three main types of cluster
validation measures available, "internal", "stabi-
lity" and "biological" (16).
It was used data from an Affymetrix micro ma-
trix experiment that compares the gene expres-
sion of mesenchymal cells of two different linea-
ges, neural crest and mesoderm derivative. The
data set consists of 147 genes and EST, which was
determined a significant different expression be-
tween the two cell lines, with at least a 1.5-fold
increase or decrease in the expression. There are
three samples for each of the cells derived from
the neural crest and the mesoderm, so the ex-
pression matrix dimension is147 6. For a more
detailed description of the data set and experi-
ments (16) originally presented in (4).
The objective of the study is that the biologi-
cal stability index and the homogeneity index
approach to the unit, indicating that they are the
optimal clusters for this data set.
Grouping methods such as: Hierarchical,
K-means, Agnes, Diana, Pam, and Clara were
applied. Besides, for each one, it was calculated an
index with different numbers of clusters, all the
code used could be found on the Rpubs website:
(http://rpubs.com/SenseiDewey7991/520472).
III. RESULTS:
Biological Stability Index Results: As it has been
mentioned in (19) that a cluster result can be con-
sidered as a partition of objects into groups. Using
the “R Software” and the “ClValid Package” the
calculation of the biological stability index for
each grouping method was performed regarding
the determined number of clusters or groupings.
A cellular process of interest may involve a re-
latively small subset of the genes in the data set
(20), thus, it must be determined the best grou-
ping method or clustering algorithm, to do so, a
line - point graph was made in order to analyze
the trend of the Biological stability index, it is ob-
served that the tendency seems to have an expo-
nential decay of the BSI in all the methods, that
is to say that this index decreases as the number
16
ISSN 2477-9105 Número 23 Vol.1 (2020)
of clusters increases, it indicates that the stabili-
ty index advise working with fewer clusters. For
more consistent answers from this database, see
(Figure 2).
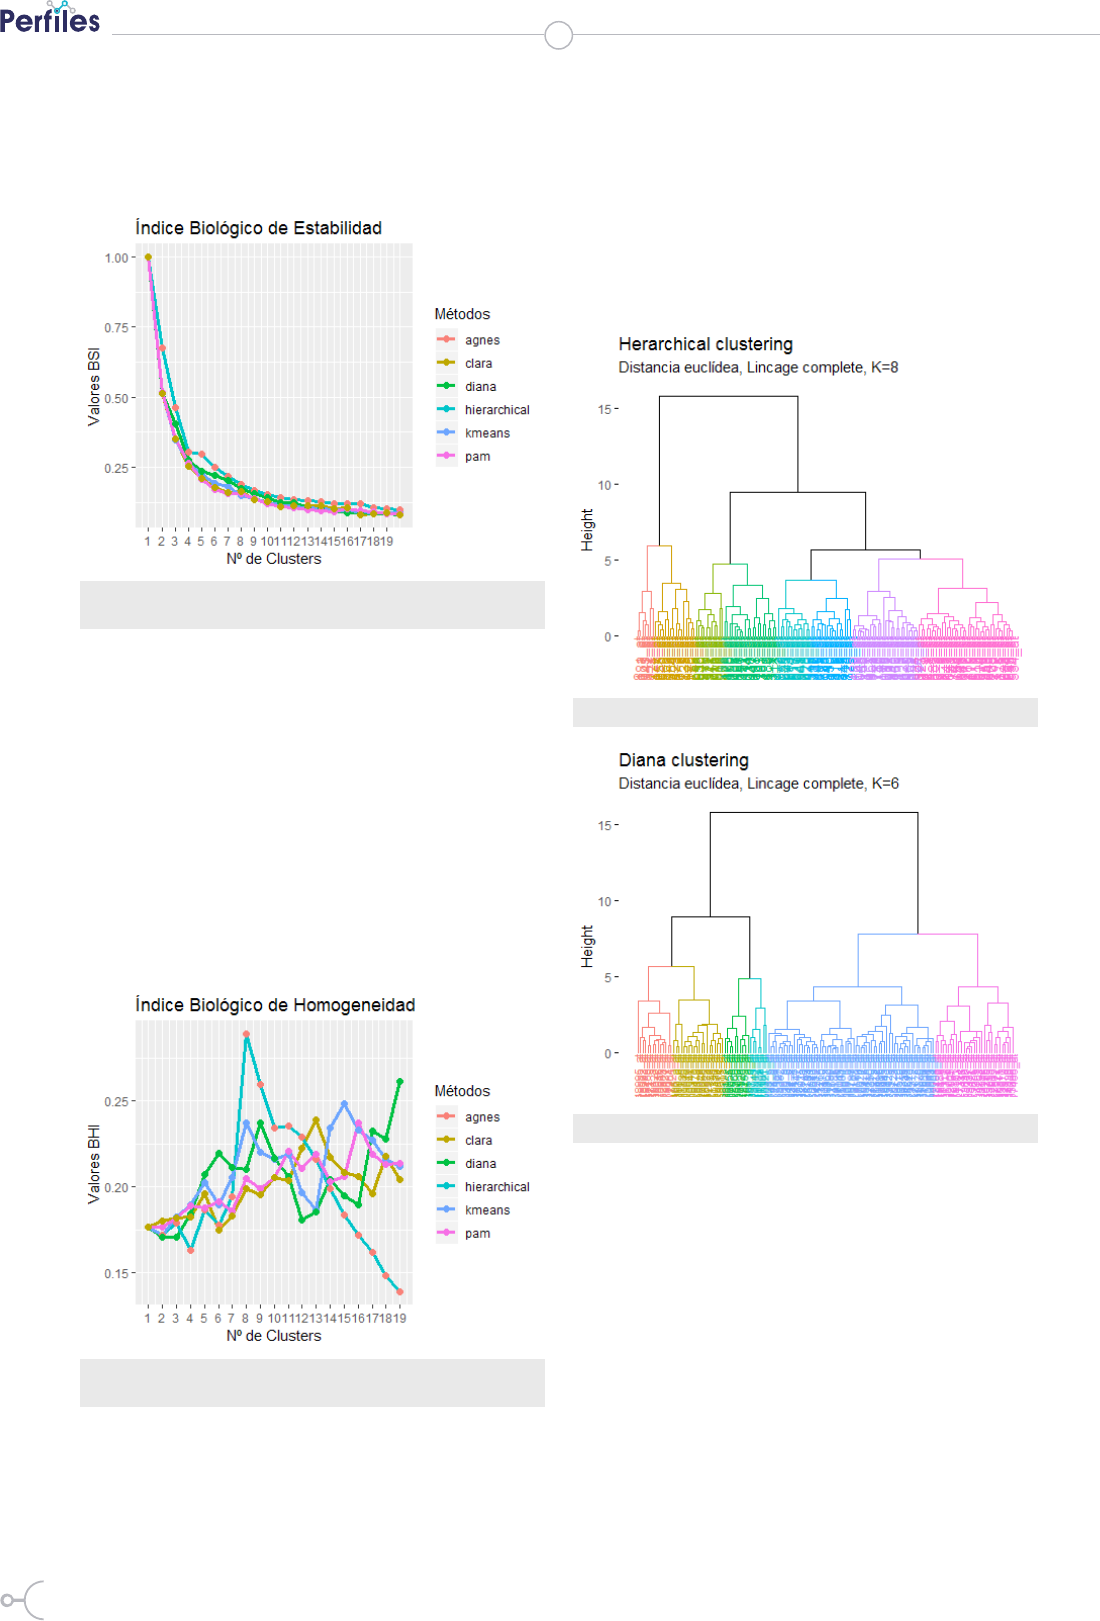
Figure 2. Graph of lines and points developed for the analysis of the trend
of the BSI according to the number of groups and methods
Biological Homogeneity Index Results: It has
been observed that as the number of clusters in-
creases the values of the IHB also increase the
opposite of the BSI, for 6 groups the Diana me-
thod stands out with a score of 0.2194 which re-
mains a small value, for 8 groups it is obtained the
highest score which is 0.2889 by the Hierarchical
and Agnes methods, which represents a higher
average proportion of gene pairs with matching
functional classes that are statistically grouped
together based on their expression profiles. BHI
values are graphically represented in (Figure 3).
Figure 3. Graph of lines and points developed for the analysis of the trend
of the IHB according to the number of groups and methods
Choice of the appropriate number of clusters:
One of the evaluation criteria for gene clustering
methods is based on their ability to reconstruct
the true underlying clustering structure (21), then
once analyzed the trend of the indices based on
the number of clusters, for this data base of The
lowest number of clusters will be chosen as stated
in the results presented by the stability index, but
taking into account the IHB suggestion that it
was 8 clusters with the Hierarchical method, and
the Diana method will also be represented with 6
clusters, this is presented in figure 4 and figure 5:
Figure 4. Dendogram for k = 8
Figure 5. Dendogram for k = 6
It has been observed in illustration 3 and 4, how
the groupings are distributed do not vary signi-
ficantly from one another, so the Diana method
is chosen regarding a BSI of 0.221188 and a BHI
of 0.219427 with 6 clusters due to it is the most
reliable answer, indeed, it is also verified in the
phylogenetic graph (figure 6) that there could be
a relation of genes according to the ramifications
they present, therefore it is a possible grouping
solution.
The capability to quantify the expression of
thousands of genes at the same time has changed
the biomedical research surface, besides it allows

17
the analysis of the gene expression pattern at the
whole genome scale (22) which makes that the
result obtained be helpful for explaining the co-
rrect genes clustering
Figure 6. Phylogenetic Graph for the Diana method with 6 clusters
IV. DISCUSSION
In this study conducted with mesenchymal cells
of two different lineages, neural crest and deri-
ved from the mesoderm, the conclusion could be
established due to the phylogenetic graph (graph
for the analysis of the genes) aid, and the biolo-
gical indices, that the optimal number of clusters
is six with the Diana Method, in article (18) it is
concluded that the final result depends largely on
the grouping method used.
Besides, this study allows proving once again
that for different number of clusters and diffe-
rent methods the biological indices vary. In (23)
the results obtained show that all the methods
mainly have clusters with an almost equal good
performance, which in this investigation shows
that there is a very similar performance in the
clustering methods.
In other publications as in (24) it is mentioned
that genes of similar function are grouped toge-
ther, furthermore, regarding the genes clusters
developed in this investigation it could be stated
that each gene cluster behaves similarly. It is very
important to emphasize that the unsupervised
methods based on existing clustering generally
suffer from significantly high false alarms (25)
thus the results may not be completely accurate.
In the article published for the clValid package
(16) there is an overview about usage analysis is
also made, with the mouse database, but it was
not possible to make a comparison with this
study since in that investigation another method
of annotating genetic expressions was used and
also other grouping methods which were not
considered in this study. There are limitations in
this work since there are many publications with
different techniques as in (26) where other and
more clustering techniques are used.
V. CONCLUSIONS
It could be evidenced that it is suitable to make
a comparison between the different existing me-
thods to group genes: the graphic method allows
the researchers to have an idea about the grou-
ping process the data tends to present; while the
analytical method aids to determine the appro-
priate number of clusters; in addition to the
method of grouping, which is seems as a great
assistance for the analyst, the results found were
compared with the phylogenetic graph which
offers another perspective of the way in which
the genes are grouped, therefore, a study should
be carried out since these methods are supposed
to be specific for the validation of genetic clusters
and should coincide indeed.
VI. ACKNOWLEDGMENTS
To the authors of the clValid package (16) for pu-
blishing their contribution freely to anyone who
Urgilés, Ulcuango, Pazmiño

18
ISSN 2477-9105 Número 23 Vol.1 (2020)
desires to investigate this topic. Furthermore, to
the authors who created the biological validation
measures used (18) we appreciate their contribu-
tion which had been published freely.
R
eferencias
1. Yan M. Methods of determining the number of clusters in a data set and a new clustering
criterion. Virginia Tech; 2005.
2. Hey T, Tansley S, Tolle K. Jim Gray sobre la e-ciencia: un método científico transformado
[Internet]. 148.206.157.233. 2009 [cited 2019 Jul 15]. Available from: http://148.206.157.233/casade-
librosabiertos/libroselectronicos/4toparadigma/4toparadigma.pdf#page=19
3. Pan H, Zhu J, Han D. Genetic algorithms applied to multi-class clustering for gene expres-
sion data. Genomics, proteomics Bioinforma / Beijing Genomics Inst [Internet]. 2003;1(4):279–87.
Available from: http://dx.doi.org/10.1016/S1672-0229(03)01033-7
4. Bhattacherjee V, Mukhopadhyay P, Singh S, Johnson C, Philipose JT, Warner CP, et al.
Neural crest and mesoderm lineage-dependent gene expression in orofacial development. Diffe-
rentiation [Internet]. 2007 Jun 1 [cited 2019 Jul 15];75(5):463–77. Available from: https://www.scien-
cedirect.com/science/article/pii/S0301468109601390
5. Moreno V, Solé X, Moreno V. Uso de chips de ADN (microarrays) en medicina: fundamen-
tos técnicos y procedimientos básicos para el análisis estadístico de resultados [Internet]. [cited
2019 Sep 4]. Available from: http://www.sc.ehu.es/ccwbayes/docencia/mmcc/docs/divulgativos/
UsoDeChipsDeADN.pdf
6. DNA Microarray [Internet]. Genetic Science Learning Center. 2018 [cited 2019 Sep 9]. Avai-
lable from: https://learngendev.azurewebsites.net/content/labs/microarray/#cite
7. Brazma A, Hingamp P, Quackenbush J, Sherlock G, Spellman P, Stoeckert C, et al. Mini-
mum information about a microarray experiment (MIAME)—toward standards for microarray
data. Nat Genet [Internet]. 2001 Dec [cited 2019 Sep 9];29(4):365–71. Available from: http://www.
nature.com/articles/ng1201-365
8. Fraley C, Raftery AE. Model-based clustering, discriminant analysis, and density estima-
tion. J Am Stat Assoc. 2002;97(458):611–31.
9. Baena DDSR, Santos DJCR, Ruiz DJSA. Análisis de datos de Expresión Genética mediante
técnicas de Biclustering. PhD thesis, Dto. Lenguajes y Sistemas Informáticos, Universidad de Sevi-
lla …; 2006.
10. Zha H, He X, Ding C, Simon H, Gu M. Spectral relaxation for k-rneans clustering. In: Ad-
vances in Neural Information Processing Systems [Internet]. 2002. Available from: https://papers.
nips.cc/paper/1992-spectral-relaxation-for-k-means-clustering.pdf%0A
11. Santhanam T, Velmurugan T. Computational Complexity between K-Means and K-Me-
doids Clustering Algorithms for Normal and Uniform Distributions of Data Points. J Comput
Sci [Internet]. 2010 [cited 2019 Sep 6];6(3):363–8. Available from: https://s3.amazonaws.com/
academia.edu.documents/35351264/jcssp.2010.363.368.pdf?response-content-disposition=in-
line%3B filename%3DComputational_Complexity_between_K-Means.pdf&X-Amz-Algori-
thm=AWS4-HMAC-SHA256&X-Amz-Credential=AKIAIWOWYYGZ2Y53UL3A%2F2019090
12. Datta S, Datta S. Comparisons and validation of statistical clustering techniques for mi-
croarray gene expression data. Bioinformatics [Internet]. 2003 Mar 1 [cited 2019 Jun 26];19(4):459–
66. Available from: https://academic.oup.com/bioinformatics/article-lookup/doi/10.1093/bioinfor-
matics/btg025
13. Kaufman L, Rousseeuw PJ. Finding groups in data : an introduction to cluster analysis.
Wiley-Interscience; 1990. 342 p.
14. Struyf A, Hubert M, Rousseeuw PJ. Clustering in an object-oriented environment [Inter-
net]. Vol. 1, Journal of Statistical Software. 1996 [cited 2019 Sep 6]. p. 1–30. Available from: https://
www.jstatsoft.org/article/view/v001i04/clus.pdf

19
Urgilés, Ulcuango, Pazmiño
15. Maechler M. Cluster analysis extended Rousseeuw et al. R CRAN. 2013;
16. Brock G, Pihur V, Datta S, Datta S. clValid : An R Package for Cluster Validation. J Stat Sof-
tw [Internet]. 2008;25(4). Available from: http://www.jstatsoft.org/v25/i04/
17. Sekula MN. OptCluster : an R package for determining the optimal clustering algorithm
and optimal number of clusters. 2015; Available from: http://ir.library.louisville.edu/etd%5Cnht-
tp://dx.doi.org/10.18297/etd/2147
18. Datta S, Datta S. Methods for evaluating clustering algorithms for gene expression data
using a reference set of functional classes. BMC Bioinformatics [Internet]. 2006 Dec 31 [ci-
ted 2019 Jun 26];7(1):397. Available from: https://bmcbioinformatics.biomedcentral.com/arti-
cles/10.1186/1471-2105-7-397
19. Yeung KY, Medvedovic M, Bumgarner RE. Clustering gene-expression data with repeated
measurements. Genome Biol. 2003;4(5).
20. Getz G, Levine E, Domany E. Coupled two-way clustering analysis of gene microarray data.
Proc Natl Acad Sci U S A. 2000;97(22):12079–84.
21. Thalamuthu A, Mukhopadhyay I, Zheng X, Tseng GC. Evaluation and comparison of gene
clustering methods in microarray analysis. Bioinformatics. 2006;22(19):2405–12.
22. Sanusi S. R and Bioconductor Tools for Class Discovery Analysis: Example Analysis with
Glioblastoma Multiforme (GBM) Data. 2017;(March).
23. Yeung KY, Haynor DR, Ruzzo WL. Validating clustering for gene expression data. Bioinfor-
matics. 2001;17(4):309–18.
24. Eisen MB, Spellman PT, Brown PO, Botstein D. Cluster analysis and display of genome-wi-
de expression patterns. Proc Natl Acad Sci U S A. 1998;95(25):14863–8.
25. Nagi S, Bhattacharyya DK. Cluster analysis of cancer data using semantic similarity, sequen-
ce similarity and biological measures. Netw Model Anal Heal Informatics Bioinforma. 2014;3(1):1–
38.
26. Datta S, Datta S. Evaluation of clustering algorithms for gene expression data. BMC Bioin-
formatics. 2006;7(SUPPL.4):1–9.